I am Downloading preliminary Ohio Crash Stats for 2024…
Hold on a sec… Maybe you should refill the coffee, this might take me a bit…

Well, it was ANOTHER BAD YEAR in Ohio… 24 cyclists were killed on Ohio Roads… because this is preliminary data, there may be more from later in the year that did not make it into the ODPS database yet…

We look, first and foremost, at the PEOPLE, not the numbers. Each of these 24 riders was a human being who was snatched from this life while riding a bicycle along the roadway… before we look at the why or the how or the Who was AT Fault, we grieve for the family and friends of the folks riding the bike… The PEOPLE include 2 kids- 9 and 12 yr old boys.
In the crash below, 2 riders were hit from behind in broad daylight- 9 year old Tide Bartlett was killed and his 10 year old riding buddy, was severely injured.

The police report is very cold – very dry – but leaves a lot to the imagination when trying to figure out exactly what happened…

We look at DATA to see what happened and why – to learn lessons from each crash – to search for common problems – problem areas of the roadway – common mistakes made – common investigative tactics and common misunderstandings… But we also order up ALL the public records for each case to try to figure out for ourselves exactly what happened in these cases, and why…
In the crash that killed 9 year old Tide Bartlett multiple news reports indicate that the area of the crash has been reported as DANGEROUS for YEARS… One resident noted that while there is a 25 mph speed limit almost nobody actually goes 25… Another recent story indicates that several people were recently appointed to a dormant BAC, Bicycle Action Committee… we’ll see what comes out of that as well…
SOME BIG PICTURE DATA ITEMS
24 killed – 2 Women & 22 men [This is pretty typical and reflects national data showing 90% of cyclists killed are male.]

AGE RANGE
The cyclists who died on Ohio’s roads in 2024 ranged in age from 9 to 78 – 2 of the riders killed were 12 and under [9, 12 yr old boys] while TWELVE/12 were 50+
[Again somewhat typical of national data as IIHS tells us that some 90% or so of all cyclists killed nationally are over the age of 20. ]

CYCLIST Average Age
48 = Average Age of the cyclist killed
49 = MEDIAN 12 below/12 Above
MOTORIST Average Age
34 = Average Age of the Motorist
This is somewhat unusual. The OLDEST motorist who killed a cyclist was 55. This contradicts the narrative that older drivers are causing carnage… at least so far as hitting cyclists is concerned. My suspicion would be that in the CRASH stats we’ll see a lot more older motorists but MAYBE the older drivers are driving slower, so while they will HIT people, maybe they are not driving fast enough to KILL people? Or maybe this was just a weird year… we’ll dig into that at some point…

LIGHT v DARK
10 crashes occurred in the dark – 14 daylight

WHEN?
Jan -2
Feb -1
Apr -3
May -4
Jun -4
Jul -1
Aug -3
Sep -1
Oct -5
[Again, Nov/Dec crashes MIGHT have occurred but not yet have been added to the ODPS data set]
LOCATION – 24 crashes
COUNTIES WHERE FATAL BIKE CRASHES OCCURRED
Cuyahoga-4,
Franklin-3,
Summit/Wood/Montgomery -2 each, and
Ashland, Athens, Clermont, Hancock, Knox, Lorain, Lucas, Medina, Richland, Stark and Tuscarawas – 1 each
So 9 in Northeast Ohio, which is a lot…
[NOTE: NONE in Hamilton County/Cincinnati.]

HIT/RUN – 5
2 in Franklin
1 each in Athens, Montgomery, Lucas
3 of the 5 have been solved
URBAN v RURAL
Ohio’s fatal bicycle crashes are spread across urban, suburban and rural landscapes. This is somewhat contrary to national data. Per IIHS stats, for 2022 [the most recent data they have posted] over 80% of the fatal crashes nationally are in URBAN areas… perhaps places like NYC, LA, Chicago and several FL cities skew the data in this direction.
Florida continues to be the WORST state for bicycle fatalities. The BIG 3 of CA, FL, TX have almost 1/3 of the entire population of the US – over 100,000,000 people.
Ohio’s population of 11.8M puts us at No. 7, behind NY, PA and IL and ahead of GA, NC and MI in the Top 10.
BUT
In 2022, the most recent data available from NHTSA, we see that Ohio’s RATE of fatal crashes [fatal bike crashes/100,000 people] is 0.07, which is WAY below the US Average of 0.33 and 1/10 the rate of FL which is 1.0. What this RATE tells us is that Ohio is, comparatively, a FAR safer place to ride a bike than MOST states in the US.
Now, 2022 was WEIRD as Ohio only had EIGHT fatal bike crashes… an anomaly during this time when we’ve been averaging more than 20. That rate of 0.7 for 8 crashes becomes 3x higher at 0.21 if we factor in Ohio’s 24 fatal crashes in 2024.
Nonetheless, even at THAT 3x higher rate, Ohio is STILL safer than MOST US states as the NATIONAL AVERAGE is 0.33… by Comparison
FL =1.0
TX =0.30.
CA=0.4
GA=0.49.
MI=0.36
IL =0.23
So, even using a more reliable data point and a much higher fatality rate, Ohio compares very favorably to the rest of the US as far a safe cycling data ….

Here’s a few more bits of data from just the spreadsheet results…
MOTORIST PreCrash Actions
Straight Ahead – 18
Making LEFT turn – 3
Making RIGHT turn -1
Negotiating a Curve -1
Other/Unknown -1
MOTORIST Contributing Circumstances
NONE- 10
ACDA/Follow too close -7
Unsafe Speed -2
Failure to Yield -3
Other Improper Action -2
CYCLIST Pre-Crash Actions
Entering Traffic Lane -3
Maklng LEFT turn -1
OTHER -9
Slowing/Stopped – 1
Straight Ahead- 10
CYCLIST Contributing Circumstances
NONE-8
Improper Crossing -2
Ran Stop Sign -2
Ran Red Light-2
Failure to Yield – 2
Defective Equipment [light] -1
Other Improper Acton 6
Lying In Roadway -1
ALCOHOL
Motorist – 1
Cyclists – 1
This seems… off… to me… usually we’ll see more drug/ alcohol involvement by motorists in fatal bike crashes.
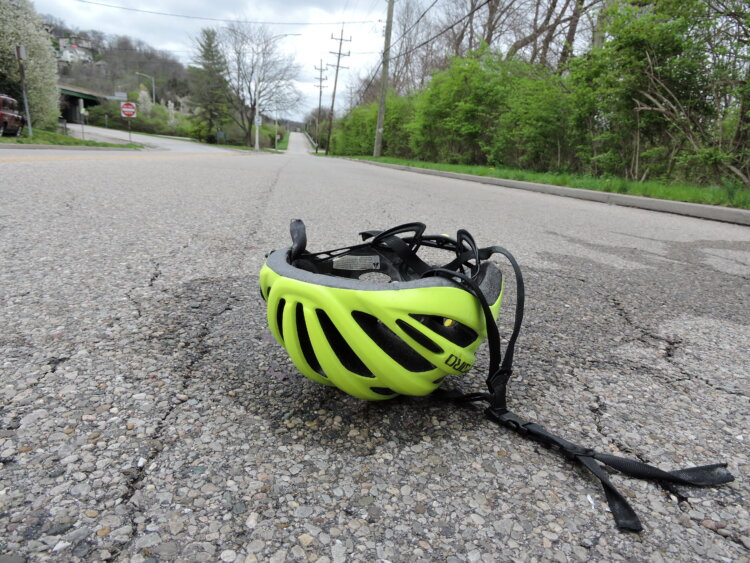
HELMET Use
Stats show only 2 riders had helmets and 1 had “Reflective clothing” – We’ll dig deeper into that once get the full reports plus photos and such …that seems like a fairly low number for helmets among the 24 cyclists killed … we’ll also have data for ALL bike crashes to look at.
Traffic deaths in Ohio, overall, have exceeded 1000 motorists/cyclists/pedestrians each year for the past several years. This is an awful trend… Some 500,000+ people are are involved in 250,000+/- car crashes each year in Ohio… A SMALL fraction of those involve bicycles…

Cycling fatalities make up 1.5-2% of those. Cycling fatalities are climbing, nationally and in Ohio, and have been since the introduction of the Double Distraction Whammy of Smart Phones + Social Media back in the 2008 time frame. Pedestrian fatalities have tracked along with cycling deaths… up up UP…
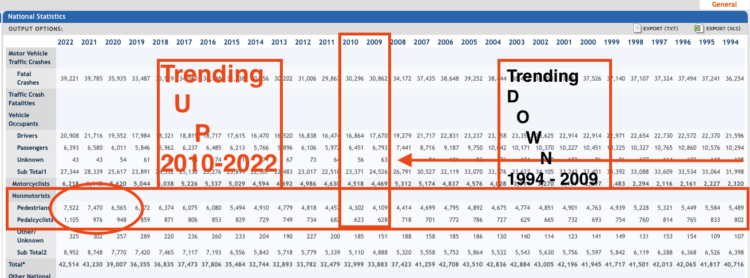
This makes me suspect that the problem is NOT that cyclists & pedestrians are riding and walking more dangerously but rather that motorists are motoring more dangerously… more to come on THAT as well once we have a chance to look at the BIG numbers in detail…
For now, we look at this introductory data- we are ordering ALL of the public records for each of the 24 fatal crashes… the photos, video, crash reconstruction, forensics, witness interviews, autopsy reports, toxicology and more… we’ll have a full review of each crash later this year once we have received, and reviewed, all the data.
Bottom Line- A LOUSY year in Ohio but…still… statistically MUCH better than MOST other states, including most of the bigger states…
Tags: bicycle, injury, insurance, municipal liability, statistics, Uninsured/Underinsured Motorist
© 2025.

