I like to study fatal crashes because they give us the most data – investigations tend to be more thorough – more care is [usually] taken in determining what happened. But the crashes tend to be more random… it’s often a matter of inches, or millimeters as to whether one survives the impact with a motor vehicle…or not… Interesting data – and a continuation of what is know a decade-long trend of more more & MORE cyclists killed.
For those of us who work with, often quite intimately, the families of those killed by road violence, these are NEVER “numbers” – they are real people who were taken from their loved ones too soon, while doing something they absolutely loved… RIDING A BIKE.
Each and after crash and death represents a horrific event, immense grief… a gut punch to the friends and family of the rider who was killed.
As the Ride of Silence approaches during the middle of Bike Month I am usually asked about WHO was killed – and we provide a list of the names of all the riders killed in Ohio for different groups to use in their Ride of Silence ceremonies.
Unfortunately, I am also reminded… annually… regularly… of the high level of APATHY that coats these numbers and data… People are dying needlessly, as the result of stupid driving and preventable errors… people are dying as the result of motoring infrastructure that puts speed ahead of safety – When we as advocates try to get government involved in analyzing or fixing problem all too often all we get is a big YAWN from the Powers That Be…

In Ohio in 2023 there were TWENTY FOUR cyclists killed on the road… 24… that’s a HUGE number for Ohio, but one that is becoming more commonplace unfortunately.
From the earliest data I have Ohio averaged around 15-16 fatalities annually. That went down over the decades leading up to 2000. From 2000-2009 we averaged 16.3 fatal bike crashes. Then 2010-2019 Ohio averaged 18.1 deaths each year… that doesn’t see like much but it represents a 12+% increase. Today we are over 20 fatal crashes every year… the number of cyclists killed each year in Ohio, and throughout the country, has jumped significantly and stayed higher than in the past. Ohio now sees over 20 fatal crashes just about every year while the number of fatal cycling crashes in the U.S. is higher than ever.
The 24 riders who were killed in Ohio in 2023 were:
| Cyclist Name |
| Jeremy Patrick Loney |
| William L Paul |
| James Kennedy Jr |
| Steven A Hirsh |
| Shawn Foster McCombs |
| Ricky Lee Miller |
| Keefer P Slone |
| Michael Szabo |
| Christopher Michael Joseph |
| Michael Richard Fullerton |
| Jayden Elwood |
| Gavin Anthony Palkovic |
| Eric Shields |
| William S Moore Jr |
| Garhet McCay Morris |
| Ross E Myers |
| Ernest R Hollinger |
| George Fill |
| Isla E Powers |
| Valerie Ann French |
| Pablo Barboza |
| Michael Minello |
| Chester L Hill |
| Erik Lee Elkins |
How “SAFE” is Cycling? What is the RISK of Riding a Bike on the Road
I frequently give talks to cycling groups about Bike Law and I include “the data” – I always preface the gloom and doom by noting something very important. Ohio, compared to the other 49 states, has historically been a VERY SAFE place to ride a bike. NHTSA publishes data on bicycle fatalities each year and shows not just the numbers but the “rate” of fatalities. The report on 2021 is found here.
The Key Findings by NHTSA highlight what I’ve been writing about for the past decade or so…

NHTSA publishes a state-by-state look at the data which looks at fatal bicycle crashes as a percentage of the total number of fatal crashes and also as a rate per 100,000 people living in the state. Nationally cycling deaths are around 2.2% of all traffic fatalities. In 2021, in Ohio, NHTSA notes that we had THIRTY cyclists killed, the most ever, and finds that this was… ta da… 2.2% of all Ohio traffic deaths. Nationally the “rate” of cycling deaths per 100,000 population is 0.29. In Ohio, the rate is 0.25, so a bit better than average.

One problem with trying to assess RISK by looking at/comparing crash data is that we don’t have a good denominator. WE know how many cycling crashes occur on the roads, how many are injured, how many are killed – we know the numerator…but we don’t know how many are riding on the road, using bike lanes, using sidewalks or adjacent paths … how many riders are there?…
What is the “risk?” How do you compare the risk of driving in a car to the risk of riding a bike? You can’t use “miles” because in an hour a car goes a lot farther than a bike. I think “hours” of “exposure” to the risk of being on the road may be a better measure than distance traveled?
It’s hard to just look at the total numbers and say anything about risk. Is the risk of being in a fatal crash while riding a bicycle on the road higher today b/c more people are being killed? Are there more riders today than we used to have so we should expect more crashes if things remain statistically even? How do we know how MANY riders there are on the roads, and whether that figure is up or down or static?
Or, if you believe the theory that have more people riding bikes on the roads actually increases safety b/c folks in cars are more used to seeing bikes around them, then maybe there are fewer folks on the road today, which is leading to this huge UPTICK in fatal crashes??
I don’t buy THAT…from what I’ve seen here and everywhere and experienced anecdotally there is still a HUGE interest in riding in Ohio and throughout the USA but we simply lack good data to tell us real numbers… which makes it difficult to assess risk. Also, as noted below, fatal crashes are somewhat random…they tend to NOT keep happening at the same spot… although they DO tend to happen in the same few different ways… and often in the Dark.
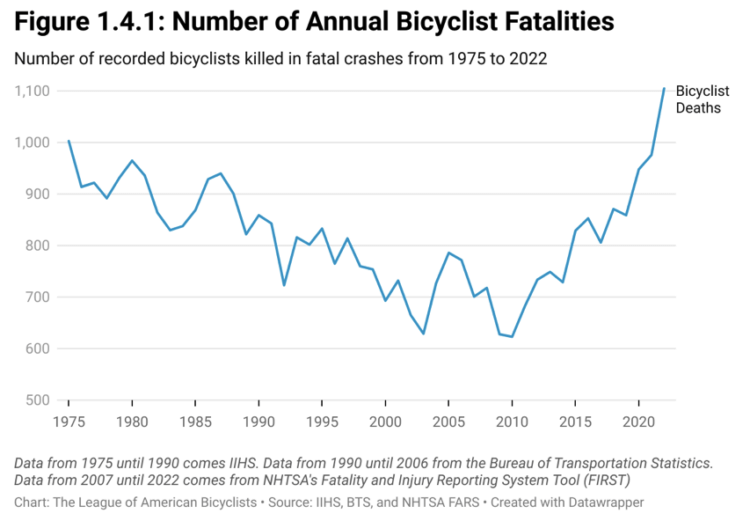
Nationally we reached a “low” in 2010 of 623 cyclists killed in the USA. Today we are between 900-1000 with one estimate of more than 1100 riders killed in 2023- the HIGHEST since 1975! Here’s the current FARS data…check out that jump in both Cyclists & Pedestrians killed… they track together, no surprise…

My untested theory as to why cycling deaths are shooting UP is to look at a combination of Cell Phones & Social Media, plus a healthy dose of speed & distraction as the leading causes of the NATIONAL and state uptick in fatalities… but who knows… again, a dissertation waiting to be written.
WHEN DO FATAL CRASHES OCCUR?
NHTSA data indicates that 45% of all fatal bike crashes occur between 6pm and midnight, with weekend nights being riskier for riders.

IS RIDER SAFETY ON THE ROADS IMPROVING?
Ken McLeod, over at The League of American Bicyclists, published a piece last month looking at the very latest FARS numbers which reflect the WORST YEAR EVER for cycling fatalities in 2022… 1105 cyclists killed…
A HUGE jump since 2009 you say?
—> oh and what happened back then – what was going on in that 2008 era?
Well, there’s another master’s thesis waiting to be written here…


WHAT ABOUT BIG TRUCKS?
At IIHS, the insurance-funded Insurance Institute of Highway Safety, the traffic research group looked at some 18,000 pedestrian crashes. They found that pickup trucks, SUVs and vans with a hood height greater than 40 inches are 45% more likely to cause fatalities than shorter vehicles with a hood height of 30 inches or less.

NPR noted in a story that IIHS found the taller front ends are also contributing to more and worse injuries while also limiting the sight lines of the motorist.

IIHS notes that the average passenger vehicle has gotten considerably bigger over the past 30 years… contributing to the UPTICK in Death on the Roads…

OHIO- 24 CYCLISTS KILLED IN 2023
Some points of interest in the 2023 data from Ohio…
Cyclists Killed – 24
Avg Age = 41
22 Men – 2 Women
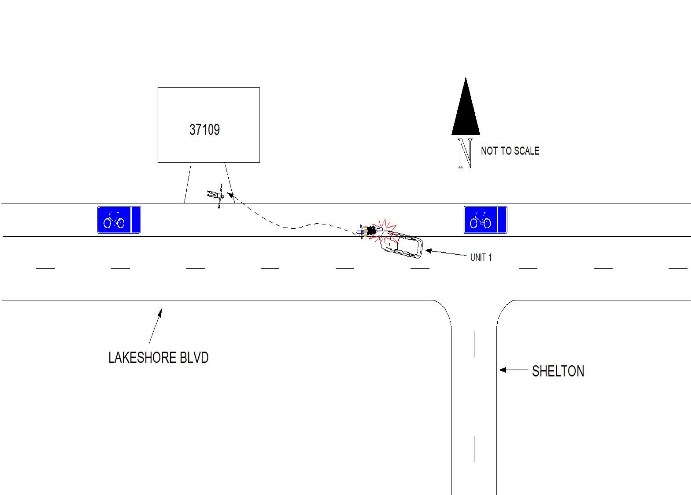
Of the 2 women killed, one was 15 yrs old and riding on the bike trail – the crash report says she failed to stop at a trail/road crossing & pulled into the path of an oncoming car…
I have … questions… about this crash [and others like it] – I’m not sure those “Stop” signs routinely posted at such crossings are really valid as a STOP sign on a road. These are NOT “intersections” between roads. Every trail in Ohio is a MUP – Multi-Use Path. You are just as likely to encounter kids on Big Wheels, folks on horseback and pedestrians as you are to encounter Cyclists. These crossings are typically painted as CROSSWALKS. There are usually Caution signs warning the motorist of the Crossing. In my view the cyclist needs to be treated as a PEDESTRIAN in a CROSSWALK, not a vehicle operator with a Stop sign…that’s not how police officers treat them.
But we’ll save that argument for another day…
The other woman killed was a 68 year old woman who was rear ended while riding on the shoulder of SR 303 in Huron County in broad daylight. No charges listed.
Age groups Of Cyclists Killed in Ohio in 2023
We are seeing, generally, middle-aged cyclists as the most likely victims of traffic violence. We know more men ride than women, but women are catching up! However, in Ohio and throughout the USA the victims of FATAL bicycle crashes tend to overwhelmingly be men… middle-aged men. In Ohio in 2023, as noted above, some 92% of those killed were men. In the US in 2021 829 of the 966 cyclists killed were men – 86%. In fact, 170 [17.5%] of those killed were men OVER THE AGE OF 65!
Here’s the breakdown of Ohio’s fatal bicycle crashes by age.
0 – 10 – 0
11-20 – 4
21 – 30 – 3
31 – 40 – 4
41 – 50 – 2
51 – 60 – 5
61 – 70 – 4
>70 – 1
Total 24 Cyclists Killed
Age <30 7
Age >30 17
NIGHT & DAY
Night/Dark/Dawn Dusk 15
Daylight 9
We KNOW that the vast majority of all cycling occurs in the daylight. However, year after year, the percentage of people killed riding bikes at night is very high- much higher than the percentage of people who actually ride at night. Night riding presents dangers – and often cyclists ride without appropriate lights and equipment for making themselves SEEN and CONSPICUOUS to motorists who, typically, “out drive their headlights” – i.e., are driving faster than they can stop if their headlights pick up something in the way…
CYCLING & DRUGS/ALCOHOL
Cyclists with “Drug Related” tags – 9 –
Cyclists with Drug Related crimes riding in the Dark? 7
So of the 15 cyclists killed at night almost HALF had some drug related issues going on. I suspect there are social issues here that could be explored in a master’s thesis.
ACDA = REAR END COLLISIONS
There were 13 rear end collisions that killed cyclists, which is troubling – we don’t think that getting rear ended is as big of a risk as it is…
BUT…
…of those 13 rear end, 9 [69%] occurred at night and only 4 in Daylight. Rear End collisions are a much bigger risk in the Dark.
The risk of DEATH is also much higher in the dark. Typically around 1/2 of all Ohio fatals occur in the dark. This year 15 cyclists killed in dark/dusk/dawn conditions = 62.5%!
HELMETS
On the Safety Equipment Used – out of 24 cyclists killed 17 had “NONE USED” so I would presume no helmet and, in the crashes occurring in the dark, NO Lights. In fact, only TWO of the cyclists had “Lighting/Bicycle” checked.
Helmets are NOT Magic – they are not. Cyclists killed by fast moving two ton bowling balls suffer serious traumatic injuries and mostly would likely be killed with or without a helmet. In slower moving crashes helmets can help protect against, or help minimize, the level of brain trauma the rider is subjected to but once the motor vehicle speed is over, say, 40 the risk of death is significant, helmet or not.
CHARGES AGAINST THE MOTORIST
Out of the 24 crashes in which cyclists were killed they’re only THREE listed with any “offense” for the motorist. One for “Speed” – one for “Failure to Stop After a Crash” and one for “Aggravated Vehicular HOmicide” … That seems ODD – Maybe the crash data we are seeing is submitted early in the investigation and don’t reflect that charges often don’t get filed until much later… after the driver is found, after the blood tests come back, after the forensic testing is complete on the phone, after the crash reconstruction is complete etc… so HOPEFULLY more motorists were arrested and charged, or ticketed… but only 1 serious charge is shown in the data we obtained from ODPS.
The 9 motorists deemed to be At Fault should have received some citation. The 4 “Unknowns” might be resolved later.
WHERE DO FATAL CRASHES OCCUR?
Geographically Ohio’s fatal bike crashes were spread out, which is typical… fatal crashes tend to be more random than predictable… It’s pretty predictable that High Street in Columbus will be the “crash-iest” street in Ohio…the street with the most bicycle crashes in Ohio – It’s long and generally straight and goes through OSU and downtown and the entire county, really… but fatals tend to be here and there…
| 1 | Butler County |
| 1 | Cuyahoga County |
| 1 | Franklin County |
| 2 | Franklin County |
| 3 | Franklin County |
| 1 | Fulton County |
| 1 | Geauga County |
| 1 | Greene County |
| 1 | Hamilton County |
| 1 | Hardin County |
| 1 | Huron County |
| 1 | Jackson County |
| 1 | Jefferson County |
| 1 | Lake County |
| 1 | Lucas County |
| 2 | Lucas County |
| 1 | Mahoning County |
| 1 | Medina County |
| 1 | Miami County |
| 1 | Montgomery County |
| 1 | Muskingum County |
| 1 | Paulding County |
| 1 | Sandusky County |
| 1 | Wood County |
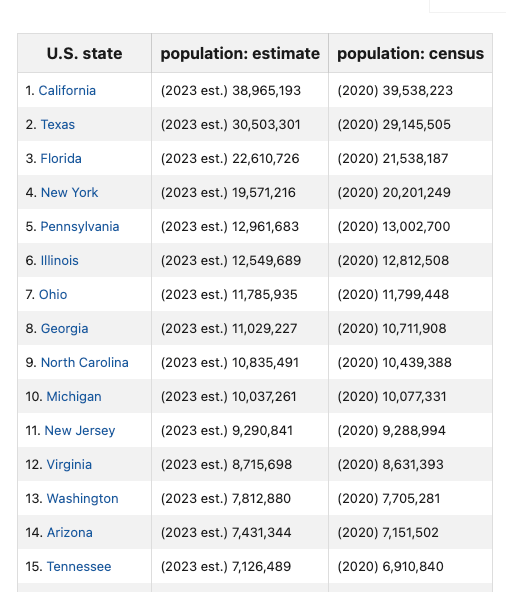
Ohio is the SEVENTH largest state with a population of almost 11.8 million. Ohio has 88 counties ranging from Franklin [Pop 1.3M] to Vinton [12K]. Ohio has 27 counties with populations exceeding 100,000 … and 61 counties with < 100,000 people.
Ohio also has a LONG history of LOTS of bicycle riding – bike clubs from the 1880s forward are well documented along with bike racing, club riding, touring, bike manufacturing, bike trails and bike infrastructure.

Ohio has a mix of bigger counties/cities [Columbus, Cleveland, Cincinnati, Toledo, Dayton…] and very rural areas. In fact, HALF of Ohio counties have less than 60,000 people and tend to be fairly rural with a “big city” as the county seat and lots of smaller villages and burgs. Of course, those counties often have very nice rural roads and make for some great riding… but we see fatal crashes occurring in our most urban, and our most rural counties, each and every year.
Franklin County/Columbus usually has the most fatal bike crashes and did in 2023, with 3 – Lucas County [Toledo] has 2.
The other 19 deaths were spread between 19 very different counties – from bigger counties like Cuyahoga [Cleveland] – Butler County [which is somewhat rural but it’s also the 7th largest county due to a large Cincinnati-adjacent suburban population]. Montgomery [Dayton] is 5th largest county- Hamilton [Cincinnati] is 3rd. Franklin is 1st. Lucas [Toledo] is 6th. Jackson County is 71st. Fulton is 58th. Paulding is 83rd.
Nationally, NHTSA tells us that in 2021 85% of all the fatal bike crashes in the US occurred in “Urban” settings. 52% of those crashes occurred in the Dark.

I like to study fatal crashes because they give us the most data – investigations tend to be deeper – more care is [usually] taken in determining what happened. But the crashes tend to be more random… it’s really a matter of inches, or millimeters, as to whether one survives the impact with a motor vehicle…or not…
NHTSA also tells us WHEN crashes tend to occur around the country.

While there are many variables – age, sex, location – for fatal cycling crashes, one thing is very clear – those cycling in the DARK face a MUCH higher risk of death than those cycling the daylight…
I mean, that makes sense, right? In the daylight a motorist is simply more likely to SEE you, perceive you, from farther back in the timeline… the motorist has more time to assess the situation ahead and take some action to avoid a crash… or to avoid simply slamming into the cyclist. The motorist may be MAD that she/has has to slow down – they may yell obscenities, honk the horn or use the 2 Ton Bowling Ball as a means of trying to intimidate the cyclist… but… they are less likely to slam into and kill the rider in the daylight than when the run up on a cyclist in the Dark…
To the FAMILIES of crash victims – these remain absolutely HORRIFIC events, not “data.” Here in our office we live with their grief for years as we work through cases, fighting insurance companies, tracking criminal cases and fighting for some measure of Justice for those who knew and loved the victim…
© 2024.

