I was a math major many moons ago – got my degree and everything and then made a right angle turn into law school. Today, my math mind still wraps itself against numbers and stats and such… I also like the physics and mathematical analysis that goes into accident reconstruction analysis. As many many hardcore gear-head riders know, the math of cycling can also be very intriguing… some would say obsessive… but I digress… what follows will be the first of several upcoming articles looking in great detail at every fatal bicycle crash in Ohio in 2010, 2011 and, eventually 2012…and beyond!
Many of my interests & passions – law, math, medicine, accident reconstruction, litigation, bicycle law and researching crashes – have come together during the past year or so as we have tried to obtain data on every fatal bicycle crash in Ohio. This has been a rigorous task. Just finding out about the crashes is a challenge. I have several Google Alerts set up to try to capture the data. Friends around the state also send me media reports on crashes. The Ohio Department of Public Safety [ODPS] keeps track of the data, but getting it from them usually means waiting 9-12 months after the year-end.
Once I find out about one, I try to grab any media reports. I want to know who investigated, whether criminal charges were filed, who they think was “at fault,” and what the view of the media is to the story. If you happen upon one of these stories, and find yourself reading the “comments” be prepared – some amazing, incredible, stupid, insolent, obnoxious, prejudiced people find time to write stuff in these comments – usually the same stuff about how bikes should never be ridden on the road, bicyclists should be licensed, taxed, ticketed and ordered off the roads… you know, the usual crap.
Sometimes these media reports indicate which agency investigated the crash, sometimes not. If it’s the Ohio State Highway Patrol [OSHP], then getting the report is easy – go to the website and order report and photos, pay the $16, download the report immediately, get the photos in a few days. But… if it’s NOT OSHP investigating, that means it was investigated by one of the 800+ OTHER LEO’s [law enforcement organizations] in Ohio, and that means it can be a real challenge to figure out who investigated, figure out who to call to get a copy of the FULL report, and then get them to send it to you.
The reports I get are usually BIG -60+ pages of numbers, measurements, analysis, toxicology reports, autopsies, witness statements. Usually in a death case, details are the rule – dozens, even hundreds, of photographs- all possible witnesses interviewed…
Sometimes, as will be discussed … not so much.
“HOW MANY CYCLISTS WERE KILLED IN 2010?
The State of Ohio has released its “Crash Facts” report for 2010. You can read it here. “Crash Facts” have been published by the State for many years and can be downloaded here. Each year there are several lines of data relating to bicycle crashes – ODPS has sent me detailed reports on every bike crash from 2005-2010.
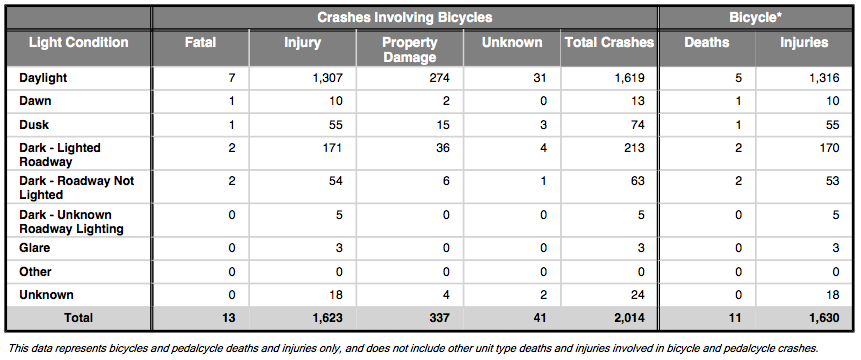
Six years – more than 12,000 “bike crashes” – seems like a lot, eh? Take a look at the 2010 Bike Crash Injury & Fatality stats in Ohio.
ODPS lists 13 “fatal” in this chart, out of 2014 crashes. The 2,014 is a very typical number. Ohio has averaged just about 2,000 “bike crashes” and around 1,600 injuries per year since 2005. The fatality numbers have been much more dynamic – and random. 13 is lower than the average, but not significantly…
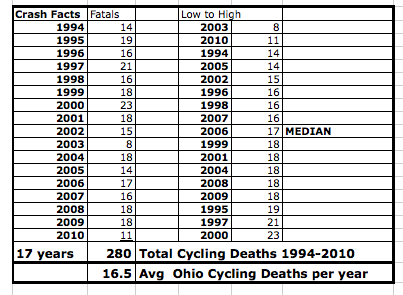
I have hard copies of older “Crash Facts” documents, which I have been collecting for many years. I took the bicycle fatality figures from those and added them to this spreadsheet to take a look at Ohio’s historical “bicycle fatality” pattern.
The Left columns are year by year – the right columns show from low to high – the lowest year was 2003 [8 fatalities] while the worst year was 2000 [23 fatalities]. The 2011 “official” figures have not been released yet, but my “unofficial” search found 12 fatalities. So far in 2012 I have found 5.
Note that I list 11, not 13, fatalities in 2010.
You have to be careful reading “charts” and “stats.” What is being measured? Where did the numbers come from? Does the number accurately reflect the particular “stat” you are looking for?
In the “Crashes Involving Bicycles” chart, above, ODPS lists 13 fatalities. This is “true” – in 2010 13 people were killed in crashes in which bicyclists were “involved” but 13 cyclists did not die!
I looked at the details of each of those 13 crashes. The crash reports, photos, etc. In 2 of them, there was a person killed… just not the BICYCLIST! In one case a motorist went off the road, hit a cyclist, a tree and a house… and then died. The cyclist was injured, but OK. In the other case, a young child rode a bike into a road and a motorcyclist struck the child and toppled over, killing his passenger, and injuring the child.
If you were off by 2 out of 2000, 1/10 of 1%, that’d be one thing… but adding 2 to 11 is a HUGE thing! So be careful when “looking up” numbers – especially when the numbers are just pulled from reports.
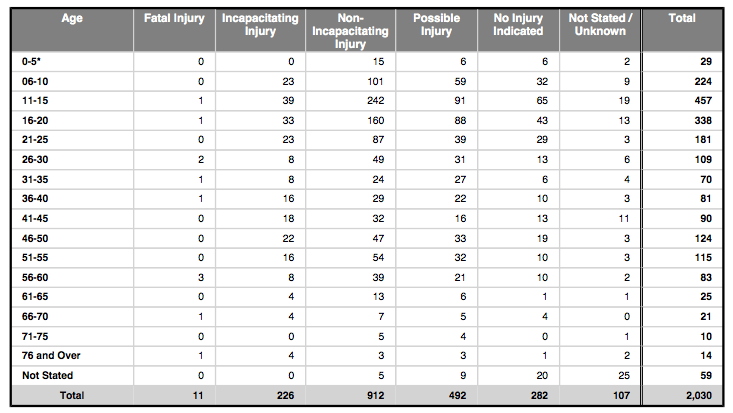
ODPS makes a comeback in another chart, though. Here, ODPS lists the age groups of cyclists injured and killed. As you will note, the two cases discussed above drop out, and the number of cyclists killed in crashes is properly shown to be 11.
WHO WAS KILLED IN 2010?
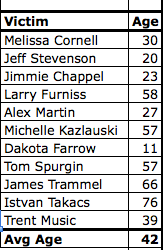
Numbers are one thing – but NEVER forget this – each of those numbers is a human being – flesh and blood. In the chart below, the riders killed in 2010 are identified.
Dakota Farrow, age 11, was the youngest victim. He rode his bike off a long driveway and was struck by a pick-up truck driven by a man with a boot on his foot due to an injury. Istvan Takacs was the oldest victim at age 76. The police report in the crash that killed Mr. Takacs has the distinction of being the WORST crash report in a death case I have EVER seen. Both of these fatal crashes will be discussed in detail in a future blog post.
As you can see, the average age was 42 – this is consistent with national data. 9 men and 2 women were killed. Again, that is consistent with national data.
The Insurance Institute of Highway Safety is a non-profit funded by automobile insurance companies. They are best known for their “crash test” ratings of motor vehicles however each year they prepare a detailed summary of bicycle crash data. One curious “fact” reported by IIHS each year is that roughly one out of every four cyclists killed each year is legally DRUNK. In 2010, IIHS “estimates” that 23% of all adult cyclists killed [128 out of 547 adults] had a Blood Alcohol Content [BAC] in excess of 0.08% – the legal standard for drunk driving.
I have simply have never confirmed that “fact” here in Ohio. I asked IIHS for their “research” and got an email simply pointing me to “FARS” data published by the federal government. Perhaps this is similar to the “chart” listed above which indicates that bicyclists were “involved” in crashes in which alcohol was a factor? Perhaps the 23% is a combination of drunk motorist and drunk cyclist data? I don’t know. In Ohio in 2010 ONE cyclist killed in a crash was known to be drunk. None of the cyclists killed in 2011 or 2012 were drunk, from my review of crash data.
WHAT HAPPENED TO THE KILLERS?
Melissa Cornell, Jeff Stevenson, Alex Martin, James Trammel and Trent Music had one thing in common- it was DARK when they were killed. Jeff, James and Trent had another thing in common- they were struck by hit and run drivers and left for dead on the side of the road…
The motorists who hit and killed Jeff, Jimmie, Michelle and James all faced “criminal” charges. I put that in “quotes” because they certainly were NOT treated like criminals.
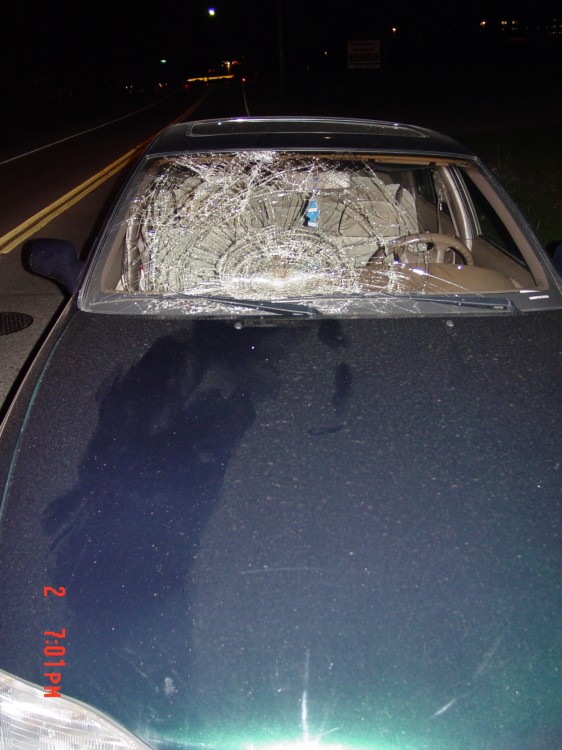
Amber Fernandez eventually plead guilty to a FELONY “leaving the scene” charge for hitting Jeff Stevenson and leaving him to die on the side of the road. Judge Guy Reece apparently felt that a Thirty DAY sentence was sufficient to punish her for killing Jeff. He also fined her $5,000, suspended her license for three years and placed her on probation for three years… boy THAT will teach her for hiding out, trying to get her bloody car windshield fixed and lying to her insurance company about what happened …
The kid who hit and killed Jimmy Chapple, Pat Hovan, plead no contest to Vehicular Manslaughter – it doesn’t appear that ANY jail time was given, although a severe wrist slap was applied in the form of a …wait for it… two year probation. Makes no sense. Chapple did NOTHING wrong – Hovan apparently just ran him over and killed him in broad daylight on the day after July 4th. ZERO jail time… but, hey, a nasty case of “probation.”
James Trammel’s case was unique. Mr. Trammel was riding on S.R. 125, a busy two-lane road, at night, without lights, wearing dark clothes, while he was VERY drunk. He was struck by a passing vehicle and killed. The crash MAY have occurred off the roadway, but a detailed investigation was not really performed after they figured out that Mr. Trammel was drunk. The lady who struck and killed Mr. Trammel, and left, Angela Reese,was eventually found… not surprisingly, she said she “thought she hit a deer” but then tried to hide out after word of Mr. Trammel’s death started circulating. She eventually plead guilty to both leaving the seene and tampering with evidence. Facing 1 year in prison on the first charge, and FIVE years on the second, Reese got an early Christmas present in December 2010 – she got a 180 day sentence and, later, an early dismissal from jail.
Michelle Kazlauski’s killer was also treated rather lightly. Michelle was riding in Pelotonia, a huge cancer fund-raiser ride. In hilly Hocking Hills, the riders had a police escort. Officers and State Troopers had stopped traffic as riders were directed down a hill and through a stop sign. Blackstone was driving a beat-up old pick-up. He had worked on the brakes that day. He claimed that he was unable to stop when the Trooper directed him to stop and he drove right past the Trooper, and into Ms. Kazlausky, killing her. Blackstone was charged with vehicular homicide. According to media reports, Kazlausky’s family was OK with a plea by Blackstone to a misdemeanor – vehicular manslaughter – and a sentence which included only community service and no jail time.
NEXT INSTALLMENT- A CASE-BY-CASE REVIEW OF EACH FATAL CRASH
Next in this multi-part installment will be the beginning a detailed review of each of the 2010, 2011 and 2012 crashes.
© 2025.
Great job Steve. Would someone who did a solo crash — no motor vehicle — be covered in the data? Although I know it’s accepted that ~90% of fatalities are motor vehicle related, it might be worthwhile to compare to total cycling fatalities in Ohio. If I remember a link from John Allen correctly, the National Center for Health Statistics has figures for that total.
This is superb work, Steve. The investigation regarding alcohol use in cyclists killed is tremendous, and possibly groundbreaking. I suggest one thing: If you can, do the same thing with cyclists injured, not just killed. Whether a cyclist is killed or injured is frequently serendipitous, so learning the alcohol content of those injured would give a clearer picture. Also, given the biases of police officers, can you do your own analysis of fault, similar to a comparative negligence kind of analysis?
Geof: Easy answer — definitely not. To be included in FARS, a crash MUST involve at least one “MV-in-transport” (i.e. not parked)… references: http://azbikelaw.org/blog/fars/
(which also corroborates the ~ 90% figure you mentioned).
Thanks Kurt! I appreciate the props!
Injury cases are MUCH harder to think about because there are 2000+ in Ohio each year… even at $4 a pop x 2000 there is a high cost of getting the records, let alone the time spent figuring out which of the 800 law enforcement organizations did the report… Fatal crashes are USUALLY thoroughly investigated by more experienced officers… injury crashes, not so much. I would love to take a detailed look at injury cases… I HAVE looked at roads… I think High Street in Franklin County/Columbus is the “crashiest” street in Ohio for bike/car crashes… not surprising… it’s a LONG road, cuts through Ohio State’s campus, runs through downtown and includes several brand spanky, hip swanky new entertainment areas… oh… and it’s basically FLAT… that helps, eh?
I don’t think solo crashes are covered unless a “police report” is generated… crashes on bike trails may generate a report from Ohio Dept of Natural Resources officers. In crashes where cyclists travel from bike trail to road, police are usually involved. However, a cyclist who just falls down and goes to the hospital will generally not make the reports I am looking at. Frankly, my interest is in studying car/bike interactions as opposed to “rider error/fall down” cases…
Thanks. Someone pointed out that NHTSA FARS only samples motor vehicle collisions. But Steve grabbed police reports … I could imagine police departments regularly covering fatal solo crashes on road.
Someone wrote something very interesting on the iBOB list about their thesis on bicycle fatalities. Assuming he finds a digital copy when returning home, I might have something very interesting to share.
Geof — here’s another mind-bender for you: does getting hit/killed by a car on the sidewalk “count”? This poor fellow got killed as he stepped out the front door of a CVS pharmacy… http://azbikelaw.org/blog/do-all-crashes-count/
Certainly “counts” in the ped-stat category… pedestrians are mowed down at an alarming rate in this country – they also do a lot of stupid things … but the stats are not good for pedestrians – 98 pedestrians killed in Ohio in 2010, and 11 cyclists…big problem…
Getting the police reports is the best – that way you can review what the police did and how they reached the conclusions… good sketches, photos, measurements can help you try to figure out what happened… a knowledge of how CYCLISTS do things helps you try to determine why the rider behaved the way she/he did in the crash…
I think the IIHS is playing some games with their “estimated” 23% cyclists being drunk.
I did the FARS extract today with 2010 data —
There were 618 (not sure why iihs has 616) cyclists killed overall.
There were 547 killed that were 16 years or older.
—
387 cyclists were tested for alcohol.
There were 84 drunk cyclist results. (BAC .08 or above).
—
I would say the percentage, then, was 13.4% (84/618).
Another way to calculate would be based on age; so 15.6% (84/547) of cyclists 16 years and older were drunk.
Another way to get the number up would be to say that 21.7% (rounds to 22, and almost the 23% figure quoted by iihs?) of cyclists *tested* were drunk (84/387)… and that if you assume that others not tested might have been drunk at this same rate.
This last bit is quite a stretch of the imagination; and kindof sloppy, if this is how the iihs supposedly got their unexplained “estimate”.
GREAT work Ed. You need to teach me how to do those types of searches…
I think IIHS IS playing games with the numbers. This is why I get reports. In most death cases, the investigation is VERY thorough. I suspect that many of the “tested but not drunk” results were autopsy results. If no autopsy was done, the coroner and/or investigating officer felt there was no need for one…they generally have the power and authority to call for an autopsy in any death case, if they think it is warranted… the 13% number seems FAR more realistic to me… I wonder if there is a way to track DUIs for cyclists?
13% does sound like a much more reasonable number. That was an astute observation Ed.
FARS queries — let me know if you have any queries you want run.
I put a spreadsheet of the items i pulled out to look at Alcohol and drug results here http://azbikelaw.org/crashReports/crashStats/FARS.xls
(addendum — in that spreadsheet mentioned below; those items are in workshett named 2010 Drug and ALC)
FARS queries — let me know if you have any queries you want run.
I put a spreadsheet of the items i pulled out to look at Alcohol and drug results here http://azbikelaw.org/crashReports/crashStats/FARS.xls
Couldn’t open the spreadsheet for some reason… got an error from excel
hmmm, sorry. probably has something to do with the exact version of office. It was created in OpenOffice but i can open it ok in my Microsoft Office (2007 , i think it is).
anyways, i put it on google docs, and made it public… it’s all there but looks a little odd because some of the formatting is off:
https://docs.google.com/spreadsheet/ccc?key=0Aj6GpPLJs2MudDJyV3VrTTdIaHRCMlNEazBEUWxRa1E#gid=4
(should open in the correct worksheet: 2010 Drug and ALC )