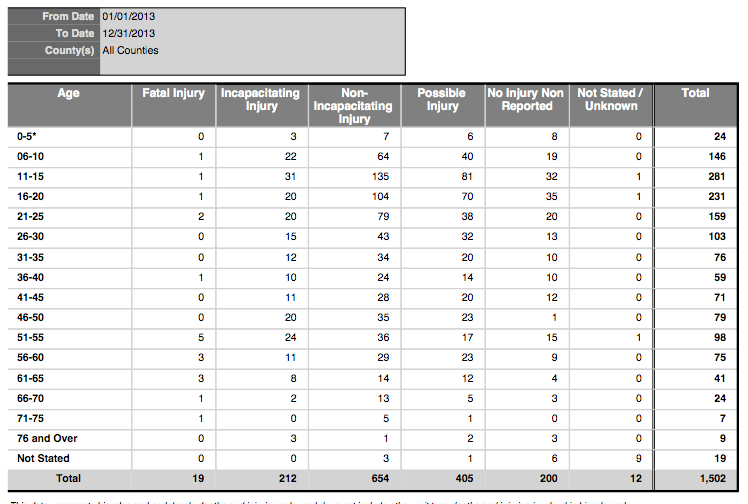
The Columbus Dispatch ran an intriguing story recently. They, and I, downloaded the most current data available from the Ohio Department of Public Safety relative to bicycle crashes and found some startling numbers. For 2013, the total crash numbers were reported as being lower… like a LOT lower… for 2013 than for any previous year recently. Could this possibly be true? Had there been Five HUNDRED fewer crashes?
I have data from ODPS showing that, from 2005-2020, Ohio averaged 2,000 “bike” crashes per year, and around 16 fatalities. What changed in 2013? I was interviewed for the Dispatch story, and told the writer I felt that there was a flaw somewhere – either they were still counting crashes or something else was up. There’s no WAY I believed that there were 500 fewer crashes in 2013 than in any prior year for which we had data..
Welllll…..
I’m not much of a horn-tooter, but it turns out I was probably right. After the Dispatch ran the story, and the story started getting picked up by news outlets throughout the state via the AP, I did a bit more digging. Turns out that the definition of a “Crash” which was “counted” in the stats changed.
In prior years, $400.00 in property damage was the figure needed to cause a crash report to be added to the state’s statistical database. However, last year that number went UP to $1000.00. So last year crashes in which the property damage was deemed to be less than $1,000.00 were not counted as “crashes” for these statistical report. This may have had a minimal impact on counting “car” crashes – but BICYCLE crashes? To get added to the “count” the cop on the street had to be trusted to safely evaluate the property damage on the bicycle and determine if was over $1000.00 in order for that report to be “counted” by ODPS? That’s nuts
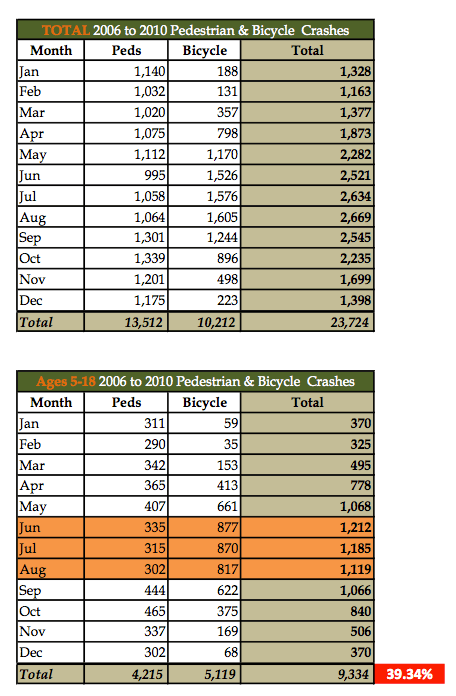
Here’s a chart ODPS did a couple years ago showing 10,212 bike crashes which occurred from 2006-2010. Average of over 2,000 per year. The point of this ODPS study was to point out the frequency with which KIDS are involved in crashes. Here, kids were involved in more than HALF of all bicycle crashes.
So, how do the 2013 numbers compare? In 2013 ODPS says 19 fatalities, which is consistent, even high compared to years past. Ohio averages around 16. ODPS lists 212 “Incapacitating Injuries” – these are serious injury crashes. 212 is consistent again with prior years.
However, where we see the big drop is in the number of “minor” injuries and crashes. In 2010 there were 912 “non-incapacitating injury” crashes and only 654 listed for 2013. 482 “possible” injuries in 2012 compared to 405 in 2013. There were 282 “non injury” crashes reported in 2010 and only 200 in 2013. These lower figures in 2013 could ALL be related to the change in reporting… or could be the result of simply fewer crashes… it’ll take a few years to see how the numbers shake out
NATIONAL DATA – FATAL CRASHES UP!
IIHS [Insurance Institute of Highway Safety] is a 501c3 funded by the insurance industry. They do the crash test “ratings” on cars – they also catalog bicycle crash stats each year. While I don’t care for their “helmet law” dogma, they have good numbers, usually quicker than NHTSA.
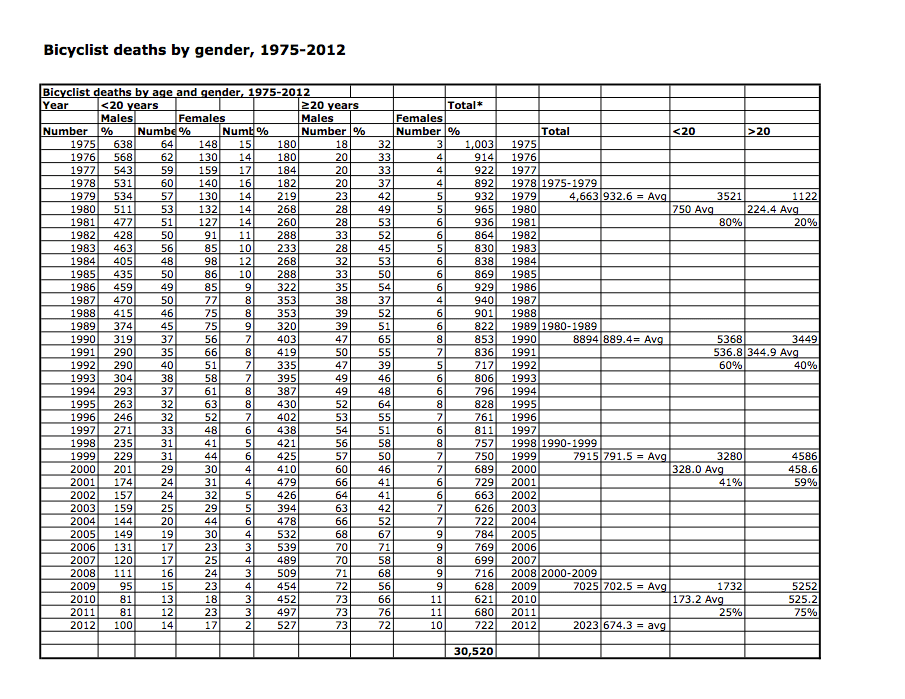
IIHS says 722 cyclists died around the country in 2012. That’s up from 680 in 2011, which was up from a recent “low” of 621 in 2010.
I looked at numbers from 1975 forward – breaking them into decades. What I found was that deaths dropped significantly each decade –
1975 – 1979 – 932.6 = Average # of Cycling Fatalities
1980-1989 – 889.4 = Avg
1990-1999 – 791.5 = Avg
2000-2009 702.5 = Avg
2010-2012 674.3 = Avg
Where did this drop come though?
I looked at the ages of the riders first -comparing data for riders under the age of 20 and over 20. I broke this data down by decade in the chart below.
From 1975-1979 these younger cyclists made up a whopping 80% of all cycling fatalities… then… as we know… time goes on and kids ride less and less … and adults ride more and more in the next big bike boom… and the stats reflect this – kids under 20 accounted for 80% of the cyclist deaths in the 70’s, 60% in the 80s, 41% of fatalities in the 90s and only 25% since 2000 Of course, that means deaths of riders over the age of 20 have risen significantly, from 20% of the total in the 1970s to 75% of those killed today. The average age of the cyclist killed today is over 40.
The “worst” year in these records was 1975, when 1003 cyclists were killed. However, 80% of those were kids. Today, MANY more [2+x more] adult cyclists are killed than during that “worst” year of 1975 – some 600 cyclists killed in 2012 compared to 212 in 1975.
That bottom line, though, is still tough to see – more than 30,000 bicycle riders killed on our nation’s roads since 1975 –
© 2025.


