As many of you know, I am a numbers guy – as an old not-quite-reformed math major who made a right angle turn, or perhaps a tangent arc, into law school, I’ve never shied away from “doing the math.”
Here’s some of the math from 2012 – Ohio had, roughly, 11,536,504 people living in its 88 counties, according to the 2010 census. I looked at the county-by-county breakdown of population for the 10 largest counties in Ohio. I then downloaded from the Ohio Department of Public Safety webpage the 2012 crash data for all of Ohio listing bicycle crashes, deaths and injuries in Ohio, and then again for each of the top 10 largest counties. I downloaded the results by Age and then reshuffled the deck and downloaded by “Light Condition” – i.e., daylight, darkness. I was wondering if things were sort of … even… all over the state … if bigger, more urban counties were more “dangerous” …
The results are, I think, rather intriguing and certainly raise more questions than they answer.
First, the overview. In Ohio in 2012 there were a total of 1928 crashes in the OSPS system in a bicycle was involved. Typically these are crashes with cars. Some may be single vehicle, or bike-to-bike, if they happen on the public roadway. They may involve parking lot crashes with cars. They likely do NOT include crashes on trails, or crashes where someone fell down on the sidewalk or their driveway.
In 2012, there were 1,525 cyclists injured in those 1,928 crashes. We lost 18 cyclists in fatal crashes. From a numbers perspective, if you happened to be in a crash, the odds of you being injured in that crash are almost 80%. However, the odds of you dying are less than 1%.
How “likely” are you to crash on any given day? I wish we had a way to figure that out, but my answer is, and remains… NOT VERY – more on that below.
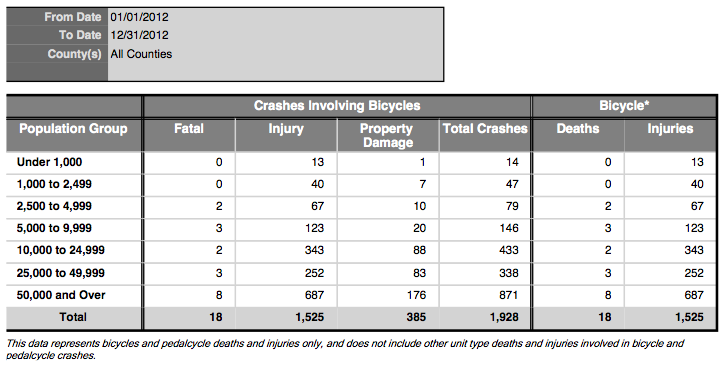
Let’s start with the the chart below from ODPS which shows the total crashes in Ohio broken down by the population of the city where the crash occurred. As you can see, 871 crashes [45% of the total] occurred in “bigger” cities [>50,000 people]. That means 55% of the crashes happened in cities with fewer than 50,000 people. According to the 2012 census figures only 15 cities in Ohio had populations exceeding 50,000. Does that mean there were a LOT of crashes in smaller rural villages and towns and not so many in Ohio’s “big” cities, with populations over 50,000? 44% [8 of 18] of the 2012 fatalities occurred in bigger cities – again are smaller, less “urban” towns seeing a lot of fatal bike crashes?

Well… now, numbers can be a tad wee bit deceiving if you don’t understand what they are or where they came from. There are something like 800+ different law enforcement organizations in Ohio which might investigate crashes. Ohio has hundreds of small townships and cities and villages and burgs and incorporated areas and towns.
Hamilton County, where Cincinnati sits, has more than 45 smaller cities- Terrace Park, Newtown, Cheviot, College Hill, Fairfax, Mariemont, etc etc etc – Each has police and fire departments, a mayor and its own special breed of “bike laws.” Each police department “investigates” crashes within its borders, along with the Ohio State Highway Patrol [OSHP] and the Sheriff. Anyone who’s “not from these parts” might categorize a Mariemont bike crash as happening in the “big city” of Cincinnati – but Mariemont’s population is only 3,403 per the census figures.
So, OK, maybe this chart isnt’ all THAT useful.
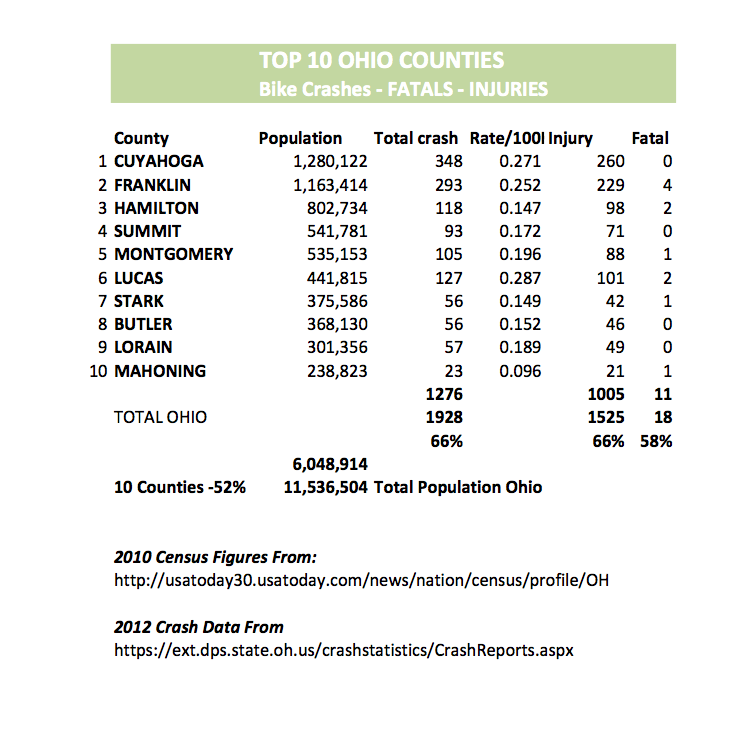
What I ended up doing was looking at the ten biggest COUNTIES in Ohio and asking the ODPS magic 8-ball computer to break down the data that way. I created the chart below to summarize the data by county.

This made a lot more sense to me. As you can see, the largest counties definitely had the most crashes, and the most injuries. However, fatal crashes are somewhat random.
At the bottom of the chart I’ve noted that the top 10 largest counties in Ohio are home to 52% of the population. So 48% of Ohioans live in the OTHER 78 counties!
These top 10 counties accounted for 66% of all the bike crashes… and 66% of all the crashes resulting in injuries to the cyclists, as well as 58% of the cycling fatalities [11 of 18].
I added a column which I called “Rate/100K” next to the total crash column. This can be called the “Crash Rate” for each county. This number is calculated as Crashes/Population x 1/1000. Basically move the decimal over 3 places in the population, round it off as your denominator and use the number of crashes as the numerator [OK, I realize I’ve lost a LOT of folks with all that super duper highly technical 4th grade math jargon… :^D ]
Since this number looks at a fairly significant length of time [one year] and a fairly significant area of space [an entire county] perhaps it will be useful in analyzing the relative “safety” of cycling in Ohio…
For Cuyahoga County [Cleveland area] the “Crash Rate” of 0.271 is the fraction 348/1280. The figure is rather useless on its own – but it gives, I think, some measure of comparison between counties. One would naturally think that there are more crashes in “bigger” counties – but is that jump proportionate to population? Cuyahoga and Franklin [Columbus] have similar Crash Rates, but they are both considerably higher than most others in the Top 10.
Cuyahoga County’s Crash Rate is almost DOUBLE the Crash Rate for Hamilton County [Cincinnati]. One way of looking at that is to say, well, if Cuyahoga County had the same Crash Rate as Hamilton County, we would have expected to see only been 188 crashes – not 348! So not only were there a LOT more crashes in Cuyahoga County than Cincinnati, there were more than one would estimate from simply looking at population differences.
What’s driving the bus there? I really don’t know at this point. Both Cuyahoga and Franklin [Columbus] counties have higher Crash Rates than most of the other Top 10 counties. Lucas County [Toledo area] wins 1st Place with the Highest Crash Rate In Ohio – a whopping 0.287. If Hamilton County had a rate of 0.287 we would have seen 230 crashes, not the 118 we had!
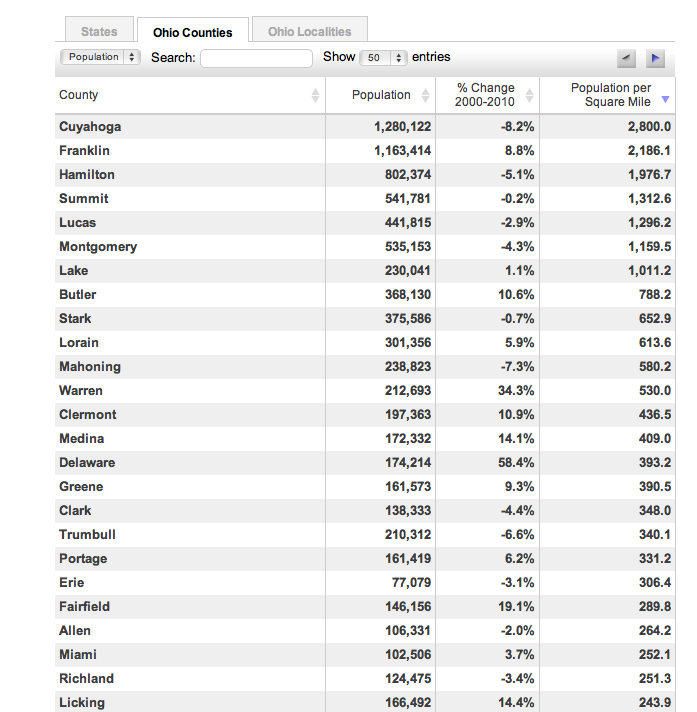
So what ELSE could be driving these Rates? How about the size of the county, or the
density of the population? More people squeezed into each square mile might lead to more road conflicts and more crashes? Makes some sense – and hey, check it out – Cuyahoga and Franklin counties are no. 1 & 2 there. Cuyahoga County has 2,800 people per square mile, while Franklin has 2,186. But Hamilton County is 3rd at 1,976 people per square mile and Lucas County doesn’t even make the top 20..
So why are there significantly more crashes and injuries in Lucas, Cuyahoga and Franklin counties than we find in other counties in the state? That’s the big question, eh? Is it “more dangerous” to ride near Toledo or Cleveland than it is to ride around Cincinnati or Akron? I wish I had a valid, statistical answer for that one, but I don’t… yet…
I think to really tease this apart, we’ll need to go crash by crash – maybe map them – or look closely at factors contributing to the crashes…
Hmmm… let’s see…
1928 crashes
x
$4.00 or more apiece to order the crash reports,
+
another $10-20 to order photographs IF they were taken
+
the time needed to carefully analyze each crash
= an expensive study which will take WAY more “free/spare time” than this hard working lawyer has at the moment… [stay tuned for that during my “retirement” some day].
Next Up – It’s As Simple as Day and Night!
Printed from: https://ohiobikelawyer.com/bike-law-101/2013/09/ohio-bike-crashes-2012-by-the-numbers/ .
© 2025.
You can leave a response, or trackback from your own site.
Trackbacks/Pingbacks
RSS feed for comments on this post ,
TrackBack URI


My inclination is that Cuyahoga Co. and Franklin Co. have more cyclists, per capita, than Hamilton Co. Certainly this isn’t the only factor that would make the “crash rate” higher in those counties, but it certainly would be a factor.
I’m not sure that is true. Cincinnati has had one of the largest cycling clubs around for many years. The cyclocross, racing and recreational rider communities are strong. Perhaps there are fewer riders on the roads – this could be due to the hills around here. However, my un-researched observations indicate that in “flat” areas riders tend to be more careless – treating the road like their own little bike trail – lots of weaving through traffic, coffee in one hand, moving up to the sidewalk when it suits them… that type of behavior is risky because it takes you out of “predictable road user” category…