BIKE CRASH STATISTICS
FROM THE FEDERAL GOVERNMENT
Looking for bicycle accident or crash statistics? They can be hard to find sometimes.
NHTSA has a LOT of publications to look at. FINDING them has always been difficult, though.
Now it’s easy.
A simple chart, found here, allows you to review an organized list of “Traffic Safety Fact Sheets.” These “Fact Sheets” discuss crashes involving bicycles, motorcycles, trucks, children, alcohol and other issues. Each issue is dealt with separately – and the list is organized by year. Each year’s report also contains some historical data so you don’t necessarily have to read every report to get the flavor of trends and numbers.
For example, the 2008 Bicycle sheet can be found here. This sheet gives you traffic crash/fatality/injury statistics for cyclists in 2008, but also reviews 10-year trends.
The 2008 figures are 6% lower than the 1998 death totals. 69% of cyclist deaths occurred in urban areas [compared to 50% in 1975]. The “typical” cyclist killed on the roadway would most likely be a male [87%] with an average age of 41. The crash killing this cyclist would have occurred at a NON-intersection [64%] between the hours of 5pm and 9pm [28%] during the months of June [9%] or September [12%]. Of the various age groupings, the largest number of deaths occurred in the 45-54 year old age group for both men [161] and women [19].
With regard to cycling deaths by state – the “Big Three” led the way.
Florida – 125
California – 109
Texas – 53
Next we have New York [42] and North Carolina [32]. No other state had more than 30 fatalities.
Florida’s deaths have definitely been followed closely by Florida’s cycling advocates. One has started a webpage which maps the deaths. You can check it out here. Around the country cycling advocates continue to be up in arms over the treatment cyclists receive from motorists, police and the media. From Portland, OR to Portland, ME you can dial up dozens of stories in the news through a quick Google search which detail harsh, unfair or blatantly criminal behavior towards cyclists.
One good way to keep up on these stories is through a Facebook group called “Cyclists Against Reckless Drivers” or through the “CARD” webpage. CARD’s founder, Steve Donaldson, updates the page daily with stories from around the world. CARD is a major proponent of the passage of “three foot laws” which would require cars to give AT LEAST three feet of clearance when passing cyclists.
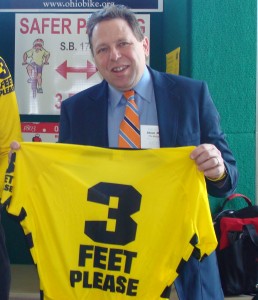
Another Three Foot proponent is Joe Mizereck, founder of the Three Foot Please webpage. Joe puts his time, energy and money where his heart is – keeping this page running through contributions and the sales of his 3 Foot Law jersey. You can see mine in the pic below. I’ve been using it as a prop during my recent speeches at O.D.O.T. conferences and for the JDRF riders.
In Ohio we’re still pushing for SB 174, introduced by Sen. Teresa Fedor. The bill would require a minimum of three feet as a safe passing distance. While not perfect [how do cops look at a situation and determine if the 3′ distance was met?] it’s as good as the current law [“safe distance”] while providing an outstanding educational tool to help teach motorists about how to pass bikes safely!
Keep on riding!
Steve Magas
The Bike Lawyer
Subscribe Via RSS Now!
© 2025.

good advice
i like these statistic charts they will help me on march 15th, 2011 when i go in front of Greenfield city council to give them my presentation on passing the 3 feet law as a city ordanance in our town. i live in ohio and i spoke to you on the phone before. wish me luck and ill let you know how everything turns out.